A deeper look at Configuration Vault | Runecast Analyzer 5.1
In the last few weeks the updates and features have been flying hot off the press and more are already in progress. There of course have been some notable additions to our patented solution, and I am going to go into more detail of Configuration Vault this time around. We believe that this will add some great diagnostic power to admins using this.
Configuration Vault
So you may be at the start of your career or a seasoned administrator, but we all know that we sometime make changes and do not always get time to document them... or we may well work in a large team and things are changed, and again in the heat of the moment we forget to get this written down or into a ticket. You may well also be trying to diagnose why an app or server is not running quite right. Think this is where Config Vault can really step in and help. In 5.1.1. release we also introduced a new summary widget in Configuration Vault to spot changes or deviations easily.
Configuration Vault gets its data in the same way our core product does – all we do is capture and store more of this useful metadata. As the data is parsed in JSON, it is also very easy to spot the difference quickly, and also as more features get added to products or their APIs we can then quickly start to capture or expose these details too.
Currently there is coverage for most parts of VMware vSphere, VMware Horizon, AWS, Kubernetes, NSX, vCD and of course AWS (Elastic IPs, Load balances, RDS clusters, RDS instances, and VPCs) and Azure, so you can even track changes whatever your cloud of choice is.
First, let’s explore VMware and an odd case I had a while ago where Configuration Vault would have helped me to find it in minutes. To set the scene, I had inherited an environment and was quite new to the role, so I was still getting a feel for the environment. Every so often we had performance issues and disconnects during parts of the day. We could never quite put our finger on it until during the investigation we turned off DRS to stop machines being moved. Some of the issues stopped, but we were now getting worse performance issues as things could not move when they were busy. What I did not have was a baseline to compare against. This is a great feature in Configuration Vault, we can also initiate this with only a few clicks. To do this, open the Configuration Vault, find the product you want to look into, and within that find the object you want as your baseline and then select the radio button. Within the window, you will now see all the differences highlighted in red.
This is now where I loop back to my issue, from here we can see a load of different processors! What was happening was the machines were moving around and not all the hosts were equal. Also if you have your scan running more regularly, you could have even spotted and pinpointed the host and proven which virtual machines were on that host when the issue occurred by cross referencing the tickets that had come in.
I also think this is a great way to check for version drift, especially when we all know upgrade windows do not always go to plan or something like that gets forgotten as you could not upgrade due to a mission critical VM not wanting to migrate off.
This is also a great place to verify your BIOS levels across your estate. For example, when mainboards might have been swapped due to a failure, they may not always be the same. I know yes we should patch it once it's replaced, but we also know that people get busy and just want to get the business back online!
One great thing Configuration Vault can help with for clouds such as AWS is configuration drift. Each time we scan, we grab a state of the environment, which is a great way of checking for any major changes, especially when we get that dreaded bill shock. What we can do is go check for changes between a set of dates to find out what may have changed.
We use the same methodology of selecting our filter and then our instance view. I know I need to check between two dates on the bill that has just landed in my inbox.

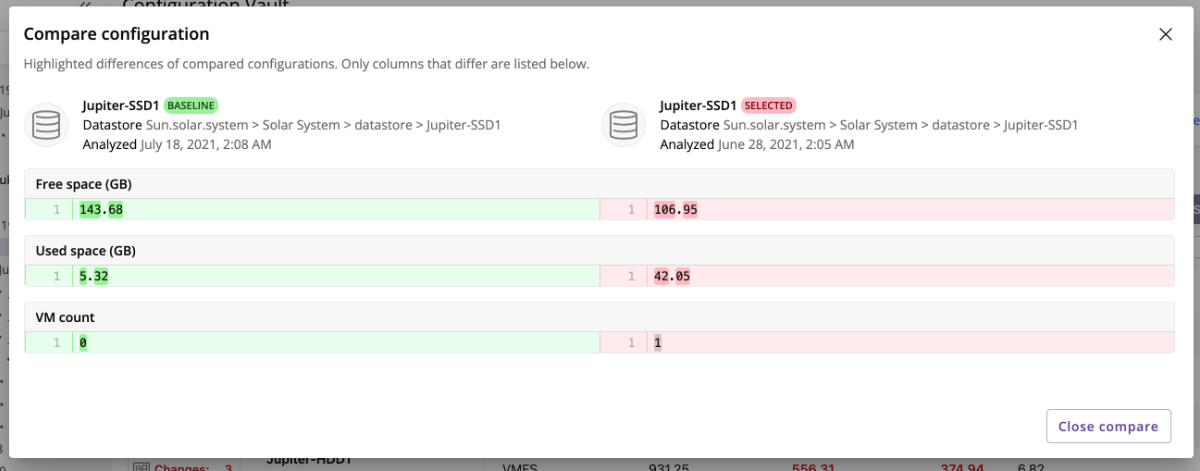
Just to flip back, remember we can do the same thing with datastore and networking in VMware, so this can also help find changes and growth if needed.
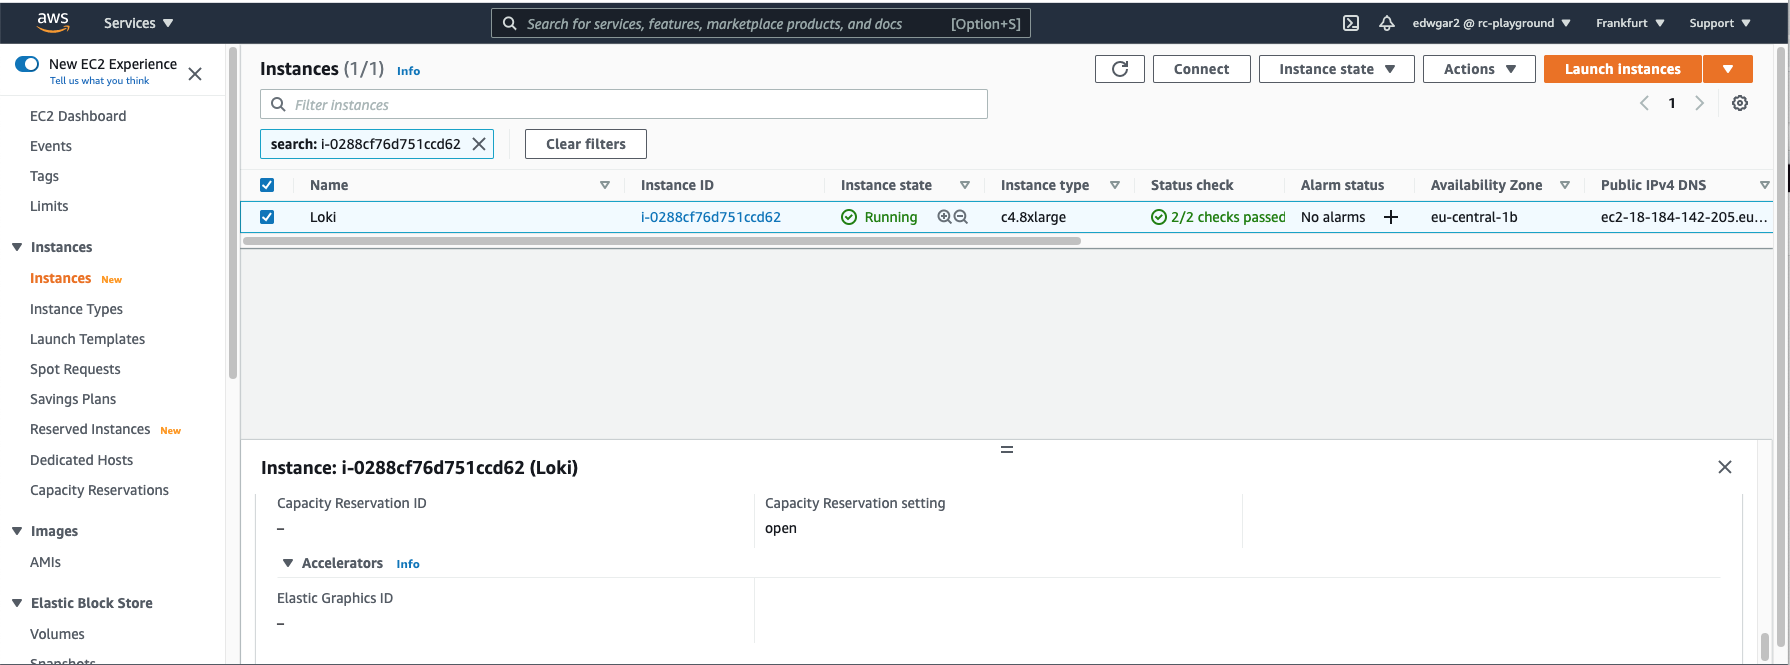
I can see that there are two new configurations within the platform. Just to validate this I logged into the AWS console, and this time round someone has been up to mischief creating a VM called Loki (With GPUS!!), which has consumed a load of resources, hence why our bill has changed between the months.
Just to flip back, remember we can do the same thing with datastore and networking in VMware, so this can also help find changes and growth if needed.

Personally, I really love this different pop up box as it instantly highlights any differences between the two states to provide you instant visibility into what has changed.
Please Note: For the most up-to-date information on Runecast Analyzer’s Configuration Vault capabilities, check out the Runecast Analyzer User Guide.
I hope this helps uncover some of the way this starts to work, and we hope to follow up with further articles showing all the different technologies this can work for. Is there anything you want to see this do or some specific tooling you may want to utilise with the results? Help us with a quick survey here or contact us if you would like follow-up to a specific point.
Meet other Runecasters here:
Download 14-day free trial
Our customers and partners tell us that, once they tried Runecast Analyzer, they couldn’t afford NOT to use it in their tech stack.


